A taxpayer constructed a manufacturing facility for $12,081,885 and was depreciating the entire capital expenditure as a 39-year straight-line cost.
This is a traditional method to retroactively save taxes through accelerated depreciation.The Problem
While straight-line depreciation is a convenient way to capture deductions (this method depreciates costs evenly throughout the tax life of a fixed asset), it’s not taking full advantage of the cost segregation process to capture significantly more deductions.
With a cost segregation study, you identify, segregate and reclassify qualifying property into asset groups with shorter depreciable lives, generally with a three, five, seven or fifteen year life.
However, categorizing property is a task for an experienced construction manager or engineer, paired with an additional professional with a CPA background. There is a whole list of subcategories of asset types, and most novices are unsure of how to categorize property properly.
A sample cost segregation study for a facility’s resulted in assets being broken down, using the MARCS (Modified Accelerated Cost Recovery System) asset lives, into the following categories:
- 5-Year Property: 23.00% of total costs
- 7-Year Property: 25.00% of total costs
- 15-Year Property: 5.00% of total costs
Because a large percentage of qualifying assets were able to be frontloaded in the 5, 7, and 15-year time frame, it’s clear the taxpayer was missing out on liberating a substantial amount of cash flow in the shorter term. In this example, bonus depreciation was applicable, adding a much more significant benefit and the property was placed in service in a short tax year, making the traditional method much less favorable.
This accelerated model of tax savings aids in quickly recovering costs from the construction project or applying future building upgrades to fortify a facility’s competitive advantage.
The Solution
The taxpayer teamed up with CTI’s cost segregation team to conduct a study of the manufacturing facility’s fixed assets.
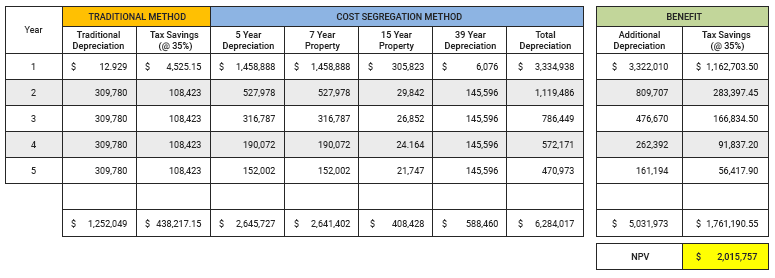
With the traditional method, the taxpayer would only see $1,252,048 in depreciation within a five-year time span. With cost segregation, however, the taxpayer will capture $6,284,017 within that same time frame. The additional depreciation is over $5 million, with a tax effected benefit of $1.76 million (as opposed to $438K).
The Result
Perhaps the most often asked question about whether to do a cost segregation or not resides around its potential to produce ROI. It’s a good question, because what is the point of partaking in such a complex process if the study isn’t going to be a sound investment?
In the above table, the NPV (Net Present Value) is the difference between the present value of cash inflows and the present value of cash outflows. NPV is used in capital budgeting to analyze the profitability of a project investment or project – in other words, a return on one’s investment.
Because the tax savings associated with the cost segregation method were far greater than that of the traditional method, the taxpayer was rewarded with over $2 million in NPV.
Ready to learn more about how a cost segregation study can save your organization cash? Download your complimentary, educational guide below.